Prometheus Monitoring Integration
Overview
Rill Flow, a powerful workflow engine service, not only offers efficient workflow processing capabilities but also includes essential system monitoring features. These monitoring features are integrated via the Prometheus component, simplifying system monitoring configuration and customization, and enabling visualization of the status and performance of the Rill Flow workflow engine.Prometheus is integrated by default in the Rill Flow project. To view monitoring metrics data, use the following command:
Metrics Path
The Rill Flow project is already integrating Prometheus.To view monitoring indicators to collect data, you can use the following command:
http:///127.0.0.1:8080/actuator/prometheus
Monitoring Guide
Customizing the Prometheus.yml File
Example configuration file:
global:
  scrape_interval: 15s

scrape_configs:
  - job_name: "Rill Flow"
    metrics_path: '/actuator/prometheus'
    static_configs:
      - targets: ['host.docker.internal:8080']
Configuration explanation:
global: Global configuration section, defining overall settings.scrape_interval: Time interval for data collection.scrape_interval: The data collection interval. In this example, data is collected every 15 seconds.
scrape_configs: Data collection configuration section, defining targets and settings for data collection.job_name: Name of the collection job, used to identify the task.metrics_path: Specifies the path for collecting metrics. In this example, set to/actuator/prometheusto collect metrics from the/actuator/prometheusendpoint.Example Visualsstatic_configs: Static target configuration section, defining targets for data collection.targets: Target address and port.targets: Address and port of the target. Set tohost.docker.internal:8080to collect metrics from port 8080 on
Deploying Prometheus
Run Prometheus using Docker:
docker run - p 90:900-v /path/to/prometheus.yml:/etc/prometheus/prometheus
Note:
- Replace
/path/towith the actual configuration file directory path.
Accessing Prometheus
Access the Prometheus interface:
http://localhost:9090
Visualization Monitoring
Advantages
The integration of Prometheus and Grafana offers robust monitoring and visualization capabilities. This is crucial for real-time system performance and status monitoring, quick problem identification, and troubleshooting. As open-source tools, they allow users the freedom to use and customize them to meet diverse monitoring requirements.This is essential for real-time monitoring of system performance and state, rapid positioning, and problem-solving.They serve as open source tools that allow users to use and customize freely to meet monitoring needs.
Grafana Download Link
Download Grafana from the following URL:
https://grafana.com/grafana/download
Configuration Guide
For guidance on integrating Prometheus with Grafana, refer to the document: Grafana’s Support for Prometheus
Effect Display
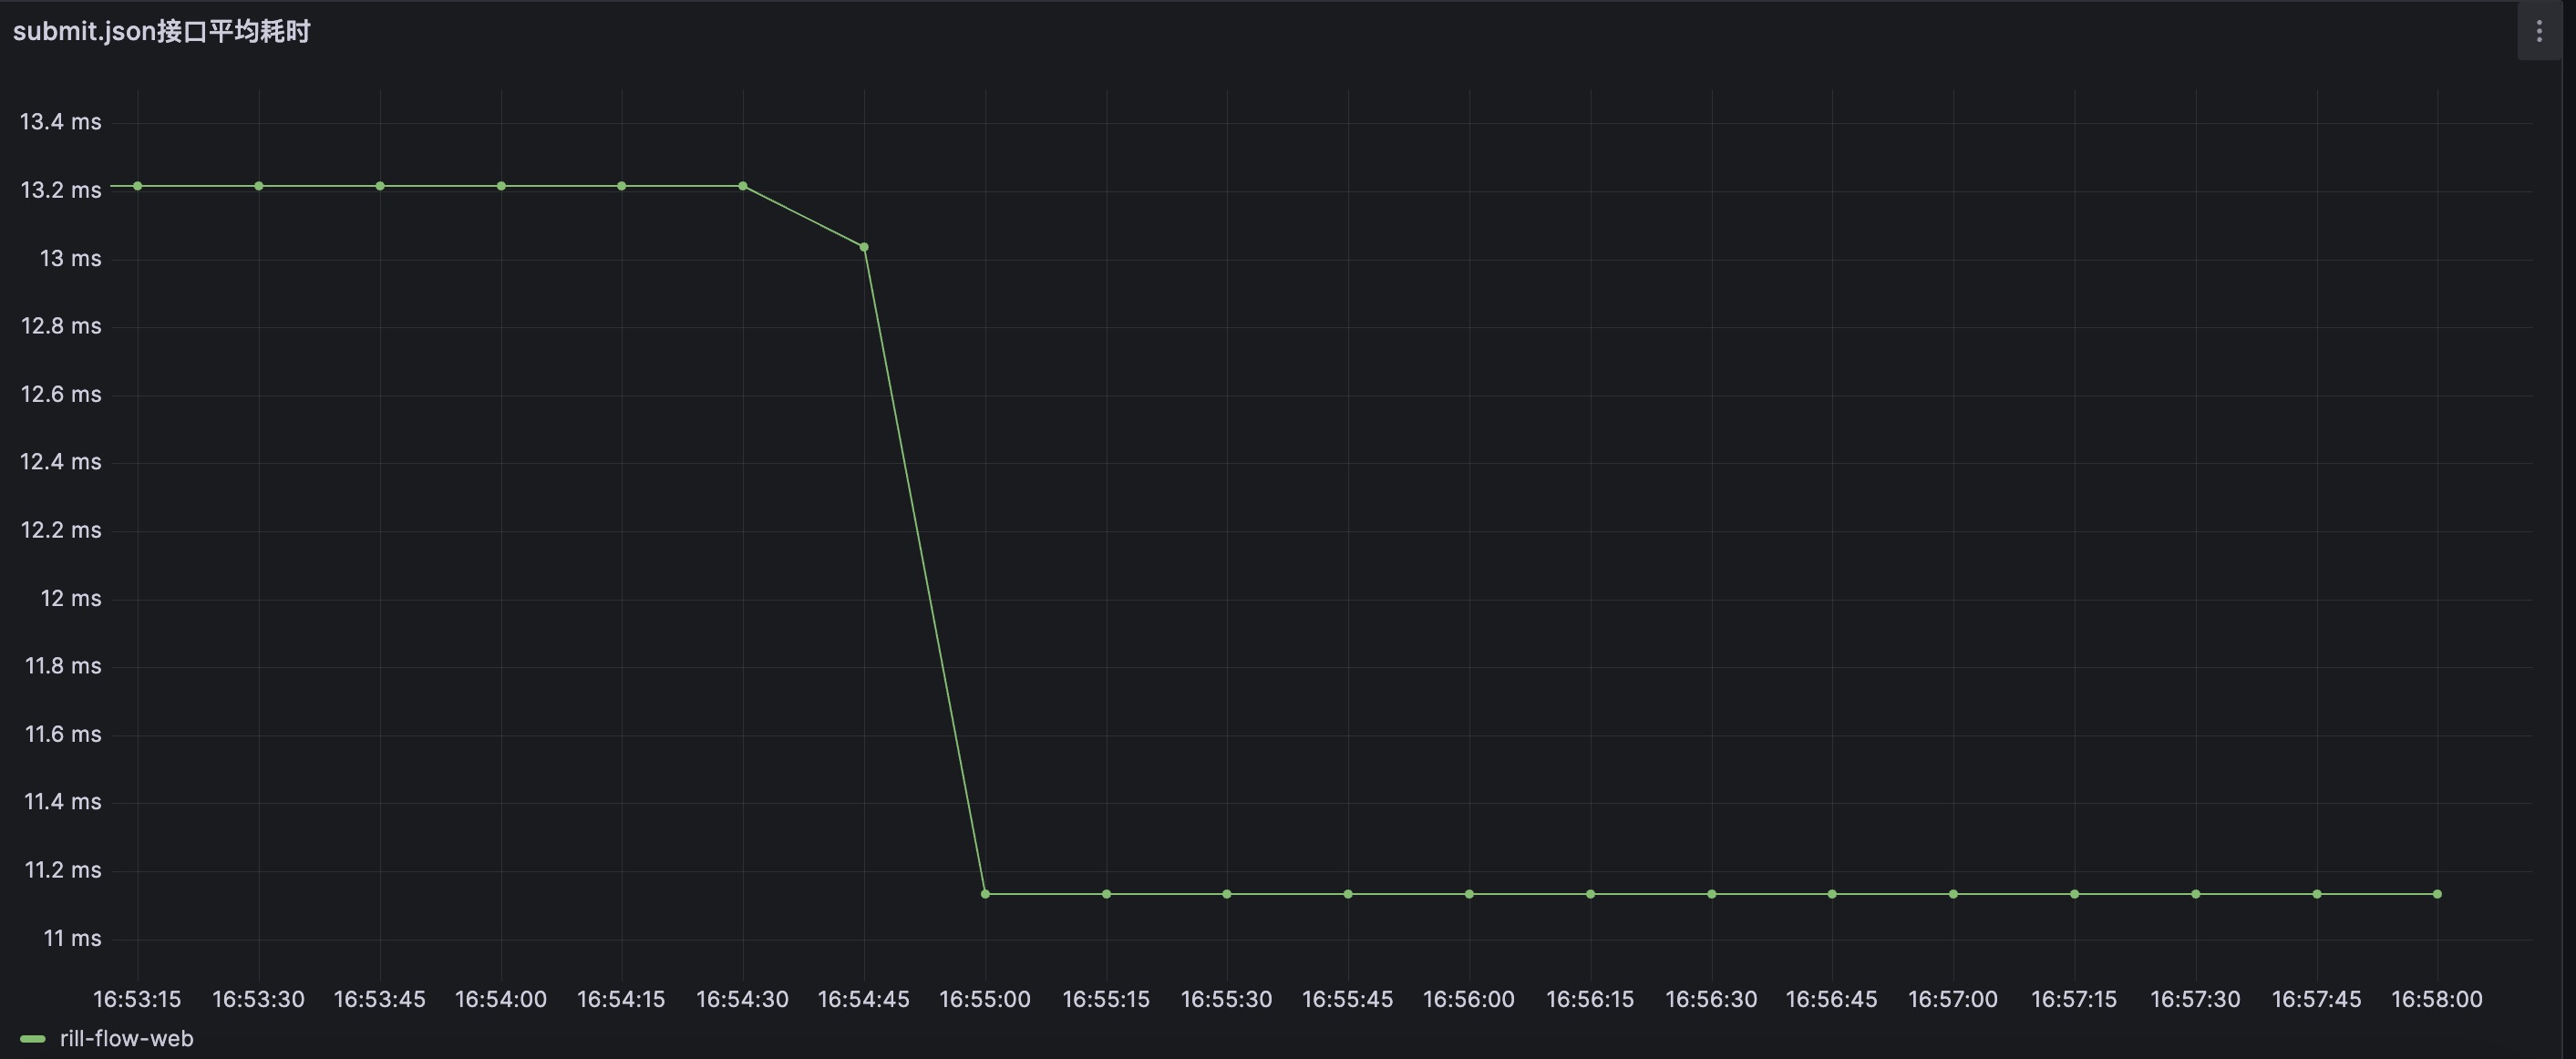
- The following image illustrates an example of a Grafana configuration showing the average response time for the
submitinterface of Rill Flow:
- The corresponding Grafana configuration JSON is as follows:
{
  "datasource": {
    "type": "prometheus",
    "uid": "e6f8f070-36b8-4303-8c13-10017ffb2ffe"
  },
  "fieldConfig": {
    "defaults": {
      "custom": {
        "drawStyle": "line",
        "lineInterpolation": "linear",
        "barAlignment": 0,
        "lineWidth": 1,
        "fillOpacity": 0,
        "gradientMode": "none",
        "spanNulls": false,
        "insertNulls": false,
        "showPoints": "auto",
        "pointSize": 5,
        "stacking": {
          "mode": "none",
          "group": "A"
        },
        "axisPlacement": "auto",
        "axisLabel": "",
        "axisColorMode": "text",
        "axisBorderShow": false,
        "scaleDistribution": {
          "type": "linear"
        },
        "axisCenteredZero": false,
        "hideFrom": {
          "tooltip": false,
          "viz": false,
          "legend": false
        },
        "thresholdsStyle": {
          "mode": "off"
        }
      },
      "color": {
        "mode": "palette-classic"
      },
      "mappings": [],
      "thresholds": {
        "mode": "absolute",
        "steps": [
          {
            "color": "green",
            "value": null
          },
          {
            "color": "red",
            "value": 80
          }
        ]
      },
      "unit": "s"
    },
    "overrides": [
      {
        "__systemRef": "hideSeriesFrom",
        "matcher": {
          "id": "byNames",
          "options": {
            "mode": "exclude",
            "names": [
              "rill-flow-web"
            ],
            "prefix": "All except:",
            "readOnly": true
          }
        },
        "properties": [
          {
            "id": "custom.hideFrom",
            "value": {
              "legend": false,
              "tooltip": false,
              "viz": true
            }
          }
        ]
      }
    ]
  },
  "gridPos": {
    "h": 8,
    "w": 12,
    "x": 0,
    "y": 0
  },
  "id": 1,
  "options": {
    "tooltip": {
      "mode": "single",
      "sort": "none"
    },
    "legend": {
      "showLegend": true,
      "displayMode": "list",
      "placement": "bottom",
      "calcs": []
    }
  },
  "targets": [
    {
      "datasource": {
        "type": "prometheus",
        "uid": "e6f8f070-36b8-4303-8c13-10017ffb2ffe"
      },
      "editorMode": "code",
      "expr": "http_server_requests_seconds_sum{uri=\"/flow/submit.json\"}/http_server_requests_seconds_count{uri=\"/flow/submit.json\"}",
      "instant": false,
      "legendFormat": "rill-flow-web",
      "range": true,
      "refId": "A"
    }
  ],
  "title": "submit.json接口平均耗时",
  "type": "timeseries"
}