Trace Link Tracking
Overview
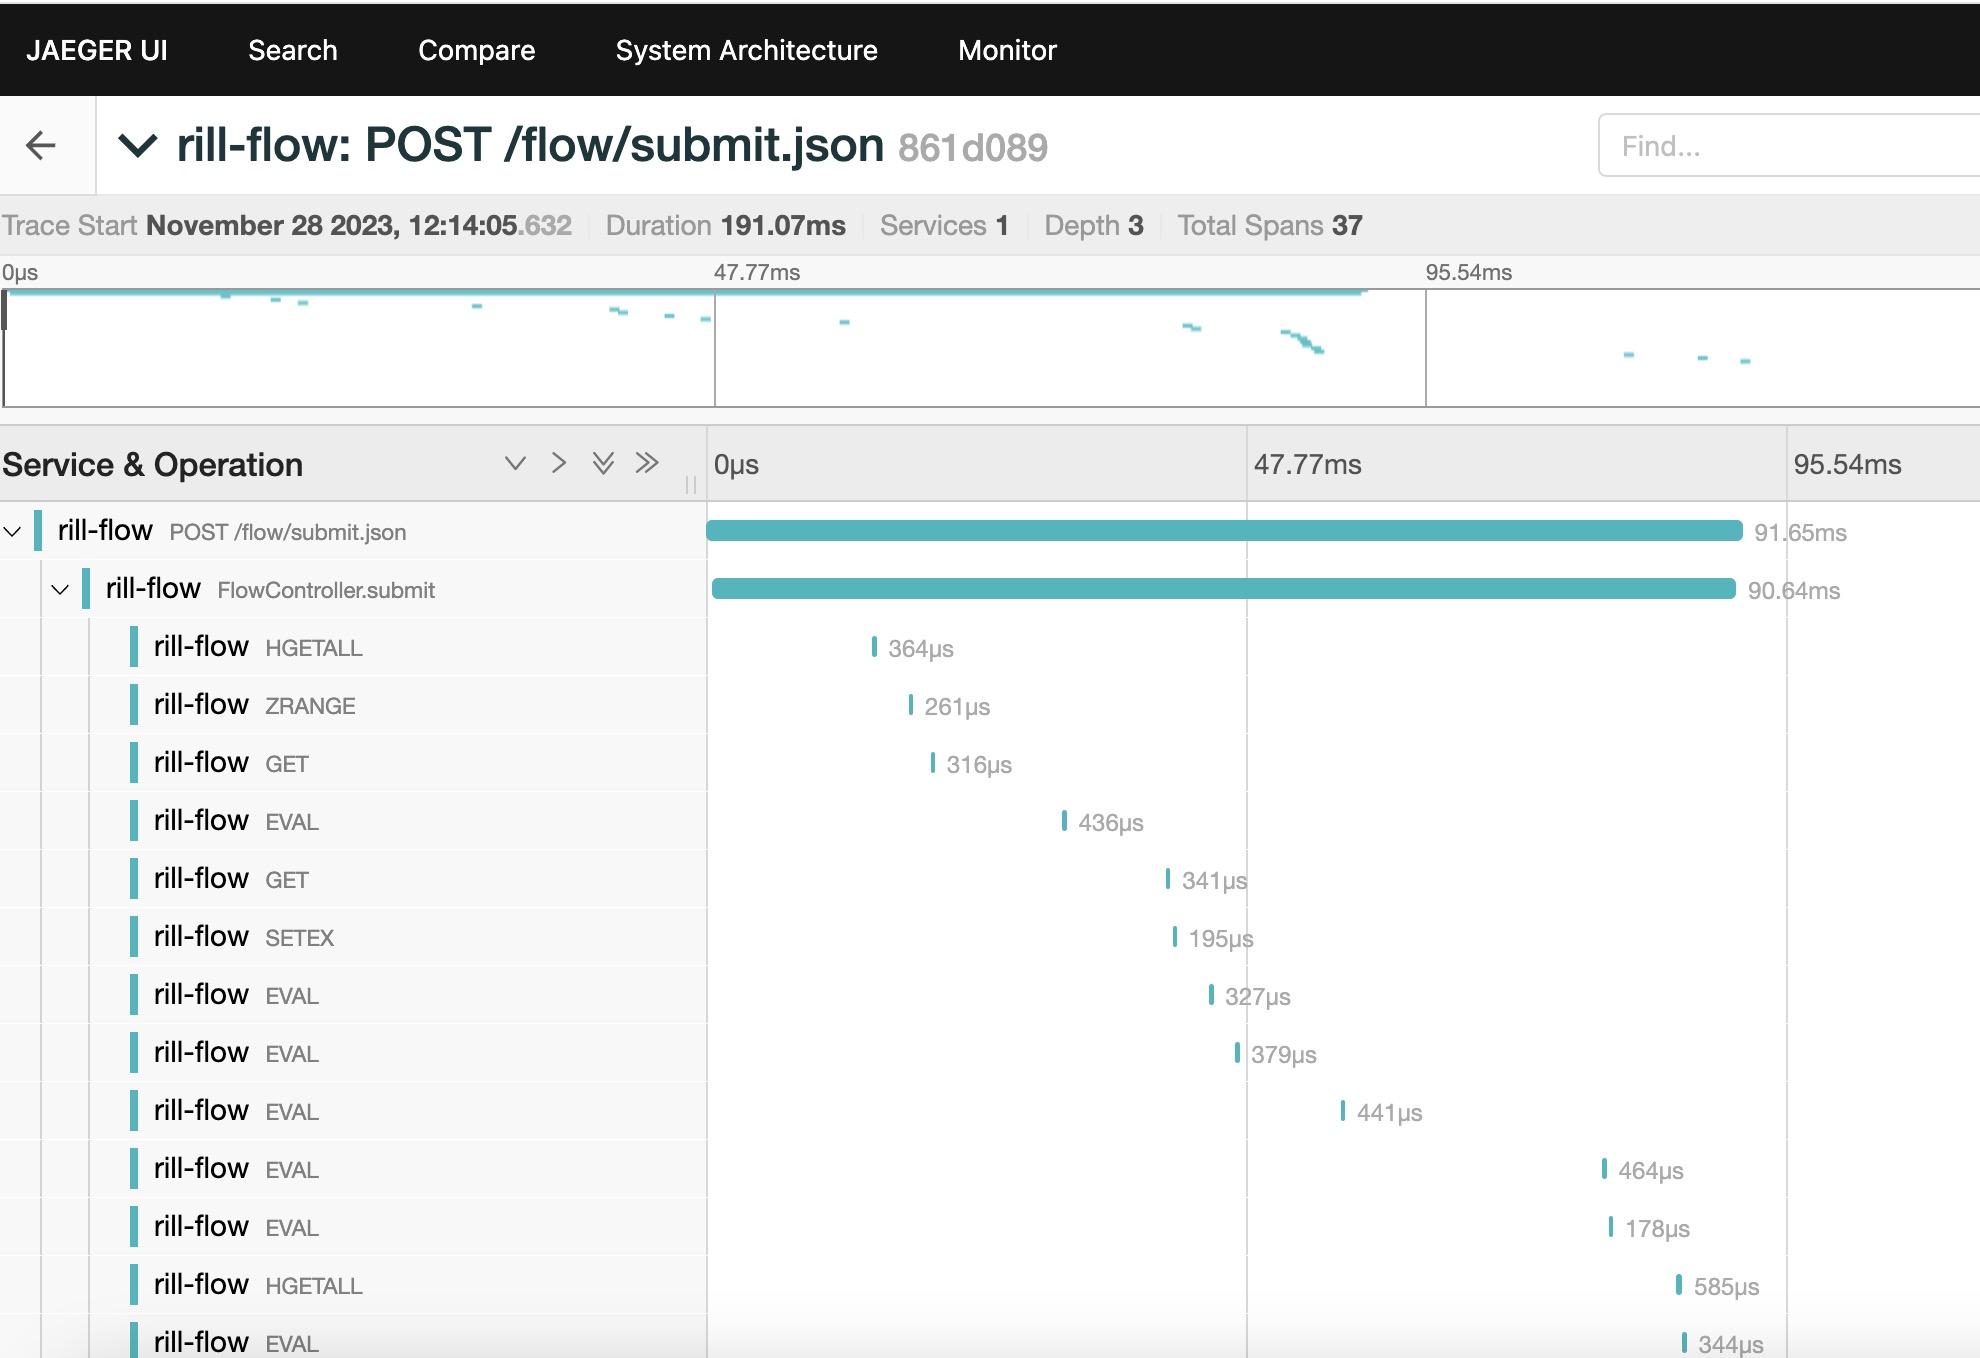
Rill Flow as a high-performance and scalable distribution process layout system introduced Trace Link Tracking to facilitate better access and understanding of workflow nodes.This feature is based on the OpenTelemetry framework implementation using the no-intrusive mode of javaagent probe and using Jaeger as an output source for OpenTelemetryRill Flow, a high-performance, scalable distributed workflow orchestration system, introduces Trace functionality to facilitate a better understanding and visualization of the execution of each node in a workflow. Based on the OpenTelemetry framework, this feature is implemented using a non-intrusive javaagent probe, with Jaeger serving as the output source for OpenTelemetry. Trace is enabled by default in Rill Flow, with Jaeger's data collection port set to 4317 and the visualization interface port set to 16686.
Viewing Trace
- To access the Jaeger visualization interface:
http:///127.0.0.1:16686/search
- Trae chart

Turn off Trace
- Remove environmental variable
RILL_FLOW_TRACE_ENDPOINT
Customizing Trace
Modifying Jaeger Data Collection Port
- Modify the environmental variable for the service
RILL_FLOW_TRACE_ENDPOINT
- RILL_FLOW_TRACE_ENDPOINT=http://jaeger:4317
Modifying Jaeger Visualization Interface Port
- Modify the
rill-flow-uiservice environment variableTRACE_SERVER
- TRACE_SERVER=http://jaeger:16686
Hiding Information of Components in the Trace
- Add the following environment variable to Rill Flow, where
JEDIScan be replaced with other component names such asHTTP,JDBC, etc.:
OTEL_INFORMATION_POPUP_TITLE