Prometheus 监控集成
概述
Rill Flow 作为一个功能强大的工作流引擎服务,不仅提供高效的工作流处理能力,还具备系统监控的重要功能。这一监控功能是通过集成 Prometheus 组件实现的,使得系��统监控的配置和定制变得简单,并能通过可视化功能监控 Rill Flow 工作流引擎的状态和性能。
指标路径
Rill Flow 项目已默认集成 Prometheus。要查看监控指标收集数据,可以使用以下命令:
http://127.0.0.1:8080/actuator/prometheus
监控指南
自定义配置 Prometheus.yml 文件
示例配置文件:
global:
  scrape_interval: 15s

scrape_configs:
  - job_name: "Rill Flow"
    metrics_path: '/actuator/prometheus'
    static_configs:
      - targets: ['host.docker.internal:8080']
配置解释:
global: 全局配置部分,定义全局设置。scrape_interval: 数据采集的时间间隔。示例中设置为每 15 秒采集一次数据。
scrape_configs: 数据采集配置部分,定义数据采集的目标和设置。job_name: 采集任务的名称,用于标识该任务。metrics_path: 指定采集指标的路径。示例中设置为/actuator/prometheus,表示采集/actuator/prometheus端点的指标数据。static_configs: 静态目标配置部分,定义采集目标。targets: 目标的地址和端口。设置为host.docker.internal:8080,表示采集host.docker.internal主机的 8080 端口上的指标数据。
Prometheus 部署
使用 Docker 运行 Prometheus:
docker run -p 9090:9090 -v /path/to/prometheus.yml:/etc/prometheus/prometheus.yml prom/prometheus
注:
/path/to替换为实际的配置文件目录路径。
查看 Prometheus
访问 Prometheus 界面:
http://localhost:9090
可视化监控
优点
Prometheus 和 Grafana 的结合,提供了强大的监控与可视化功能。这对于实时监控系统性能和状态、快速定位及处理问题至关重要。它们作为开源工具,允许用户自由使用和定制,以满足各种监控需求。
Grafana 下载链接
访问以下链接下载 Grafana:
https://grafana.com/grafana/download
配置指南
想要了解如何将 Prometheus 与 Grafana 结合使用,请参阅以下文档:Grafana 对 Prometheus 的支持
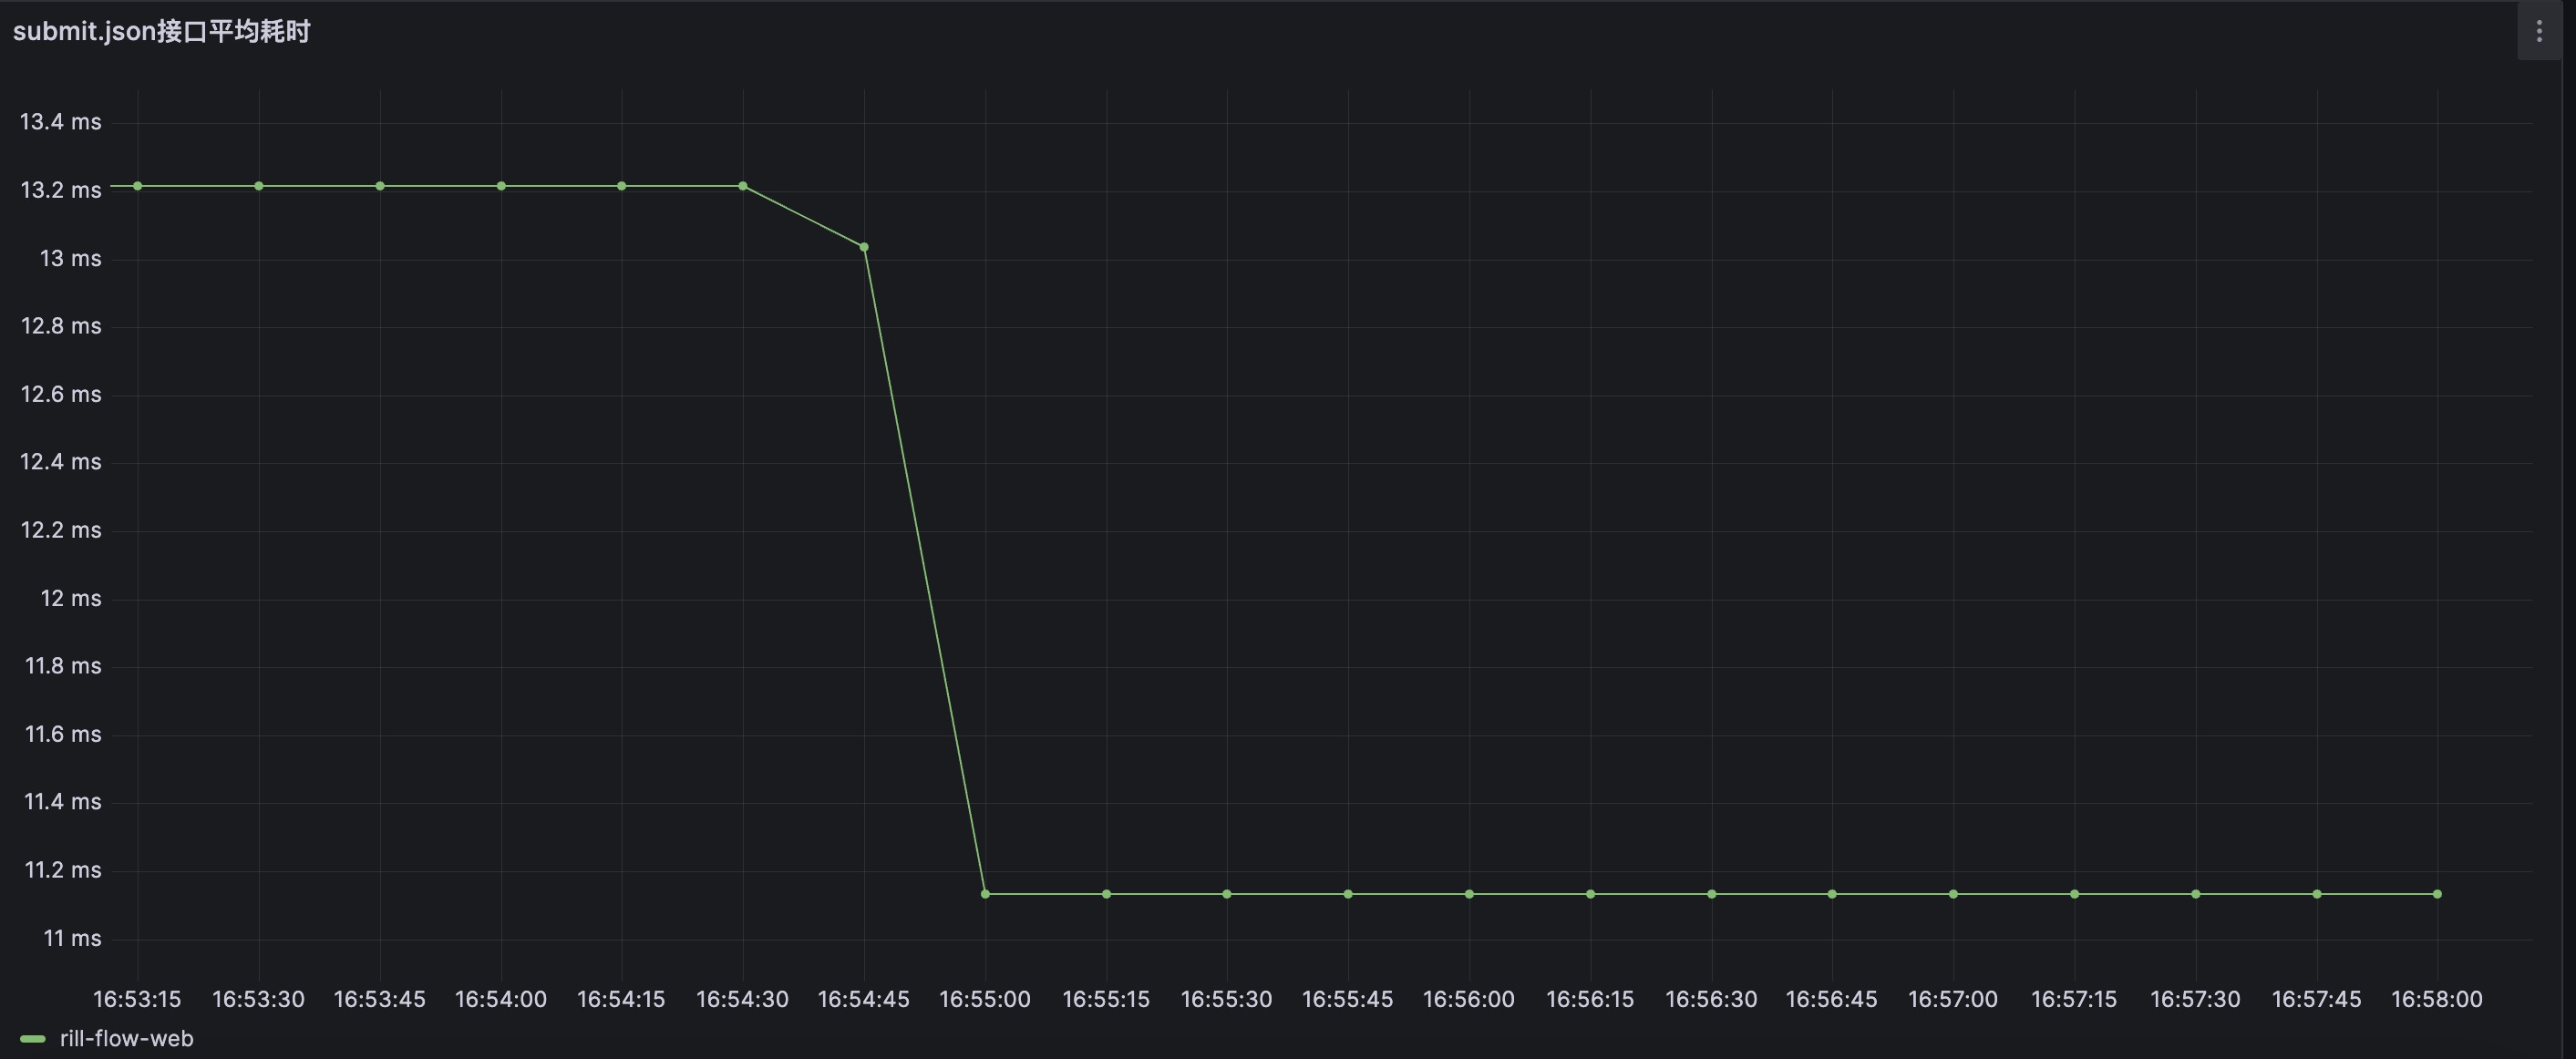
效果展示
- 下图展示了使用 Grafana 配置 Rill Flow 的
submit接口的平均响应时间的示例:
- 相�关的 Grafana 配置 JSON 示例如下:
{
  "datasource": {
    "type": "prometheus",
    "uid": "e6f8f070-36b8-4303-8c13-10017ffb2ffe"
  },
  "fieldConfig": {
    "defaults": {
      "custom": {
        "drawStyle": "line",
        "lineInterpolation": "linear",
        "barAlignment": 0,
        "lineWidth": 1,
        "fillOpacity": 0,
        "gradientMode": "none",
        "spanNulls": false,
        "insertNulls": false,
        "showPoints": "auto",
        "pointSize": 5,
        "stacking": {
          "mode": "none",
          "group": "A"
        },
        "axisPlacement": "auto",
        "axisLabel": "",
        "axisColorMode": "text",
        "axisBorderShow": false,
        "scaleDistribution": {
          "type": "linear"
        },
        "axisCenteredZero": false,
        "hideFrom": {
          "tooltip": false,
          "viz": false,
          "legend": false
        },
        "thresholdsStyle": {
          "mode": "off"
        }
      },
      "color": {
        "mode": "palette-classic"
      },
      "mappings": [],
      "thresholds": {
        "mode": "absolute",
        "steps": [
          {
            "color": "green",
            "value": null
          },
          {
            "color": "red",
            "value": 80
          }
        ]
      },
      "unit": "s"
    },
    "overrides": [
      {
        "__systemRef": "hideSeriesFrom",
        "matcher": {
          "id": "byNames",
          "options": {
            "mode": "exclude",
            "names": [
              "rill-flow-web"
            ],
            "prefix": "All except:",
            "readOnly": true
          }
        },
        "properties": [
          {
            "id": "custom.hideFrom",
            "value": {
              "legend": false,
              "tooltip": false,
              "viz": true
            }
          }
        ]
      }
    ]
  },
  "gridPos": {
    "h": 8,
    "w": 12,
    "x": 0,
    "y": 0
  },
  "id": 1,
  "options": {
    "tooltip": {
      "mode": "single",
      "sort": "none"
    },
    "legend": {
      "showLegend": true,
      "displayMode": "list",
      "placement": "bottom",
      "calcs": []
    }
  },
  "targets": [
    {
      "datasource": {
        "type": "prometheus",
        "uid": "e6f8f070-36b8-4303-8c13-10017ffb2ffe"
      },
      "editorMode": "code",
      "expr": "http_server_requests_seconds_sum{uri=\"/flow/submit.json\"}/http_server_requests_seconds_count{uri=\"/flow/submit.json\"}",
      "instant": false,
      "legendFormat": "rill-flow-web",
      "range": true,
      "refId": "A"
    }
  ],
  "title": "submit.json接口平均耗时",
  "type": "timeseries"
}